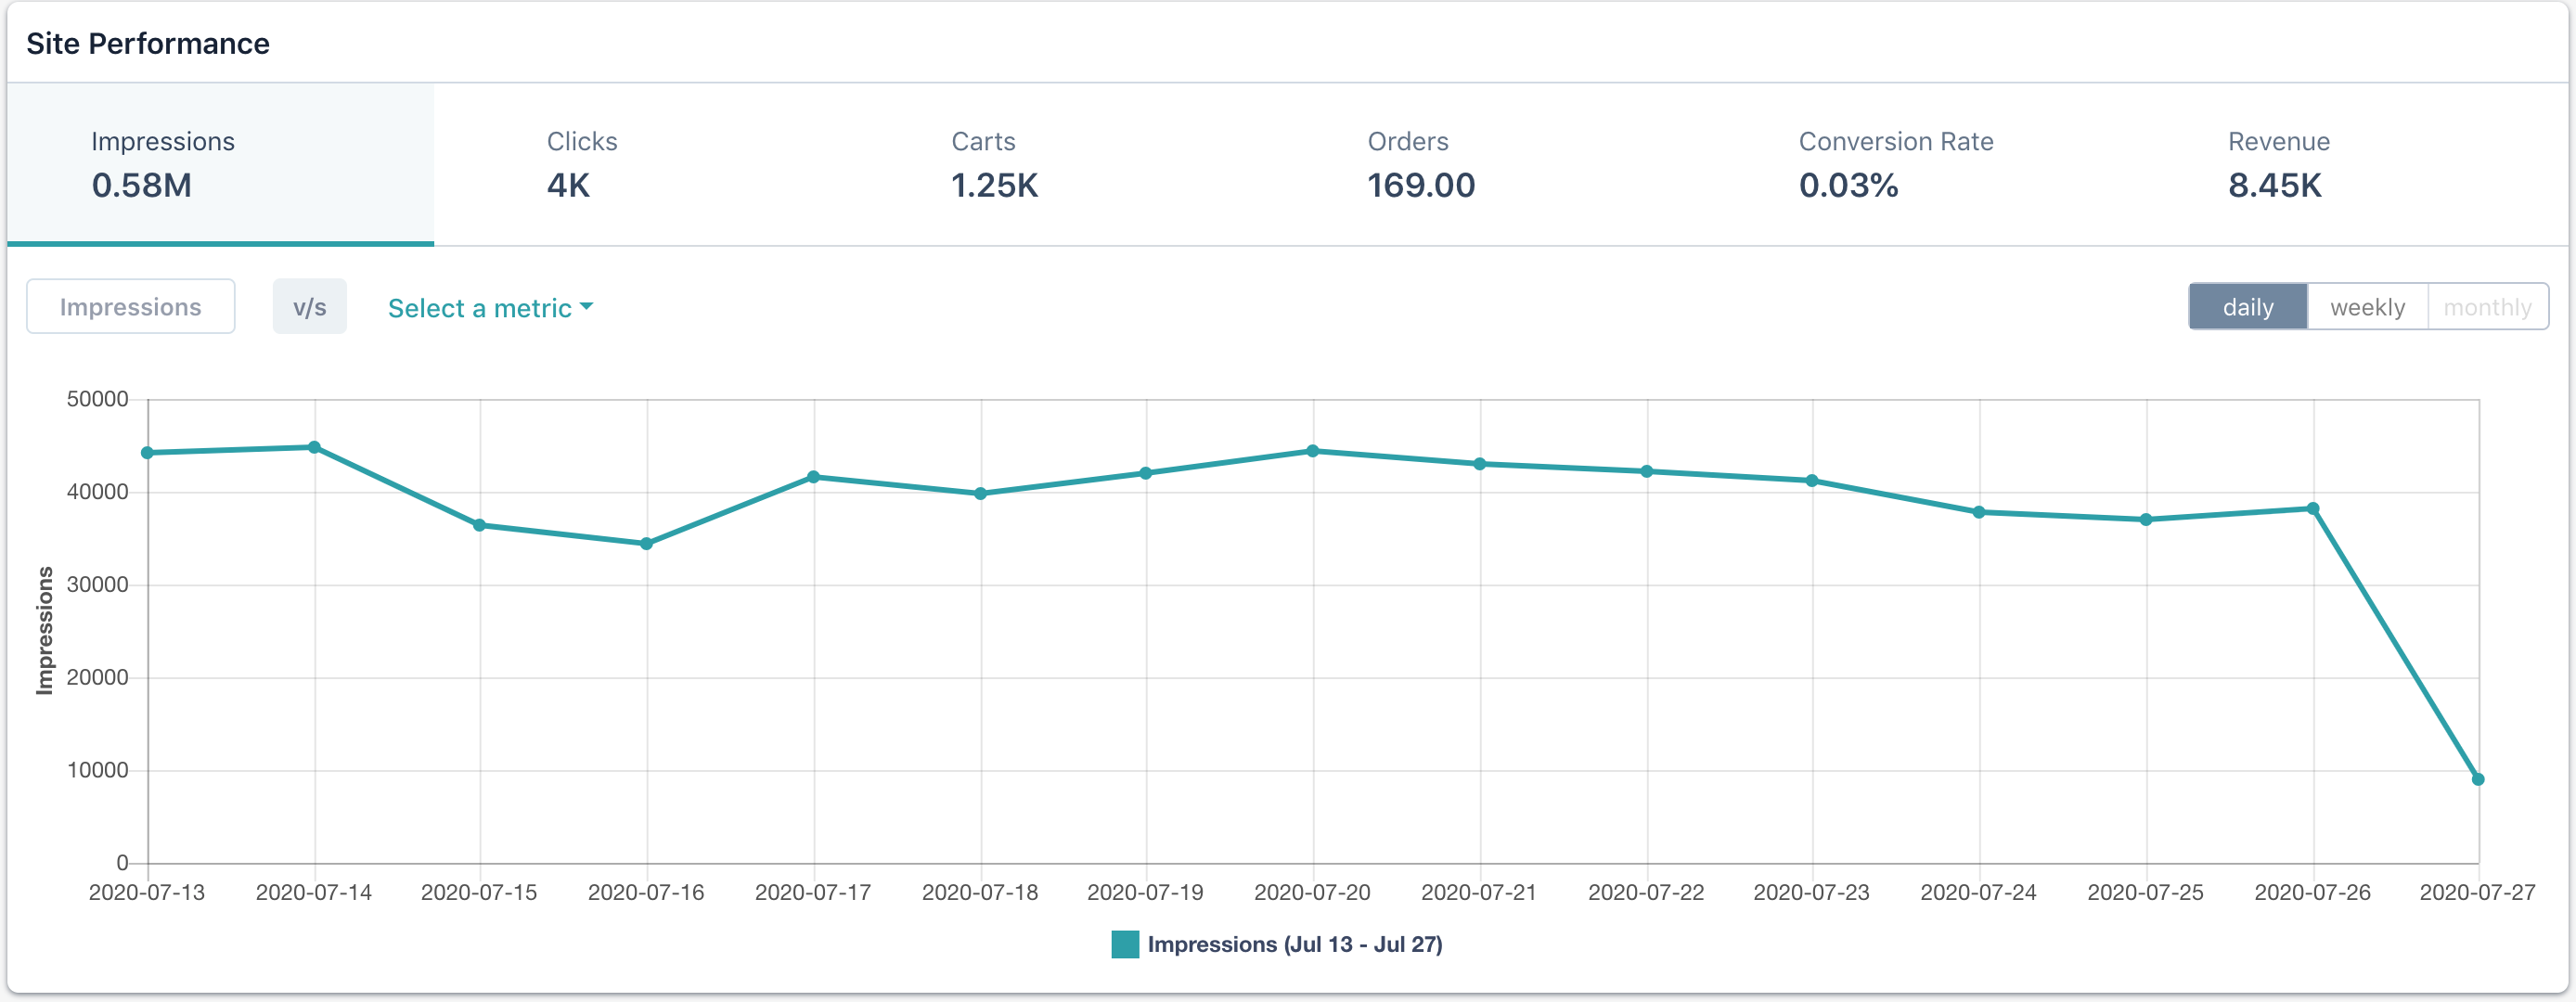
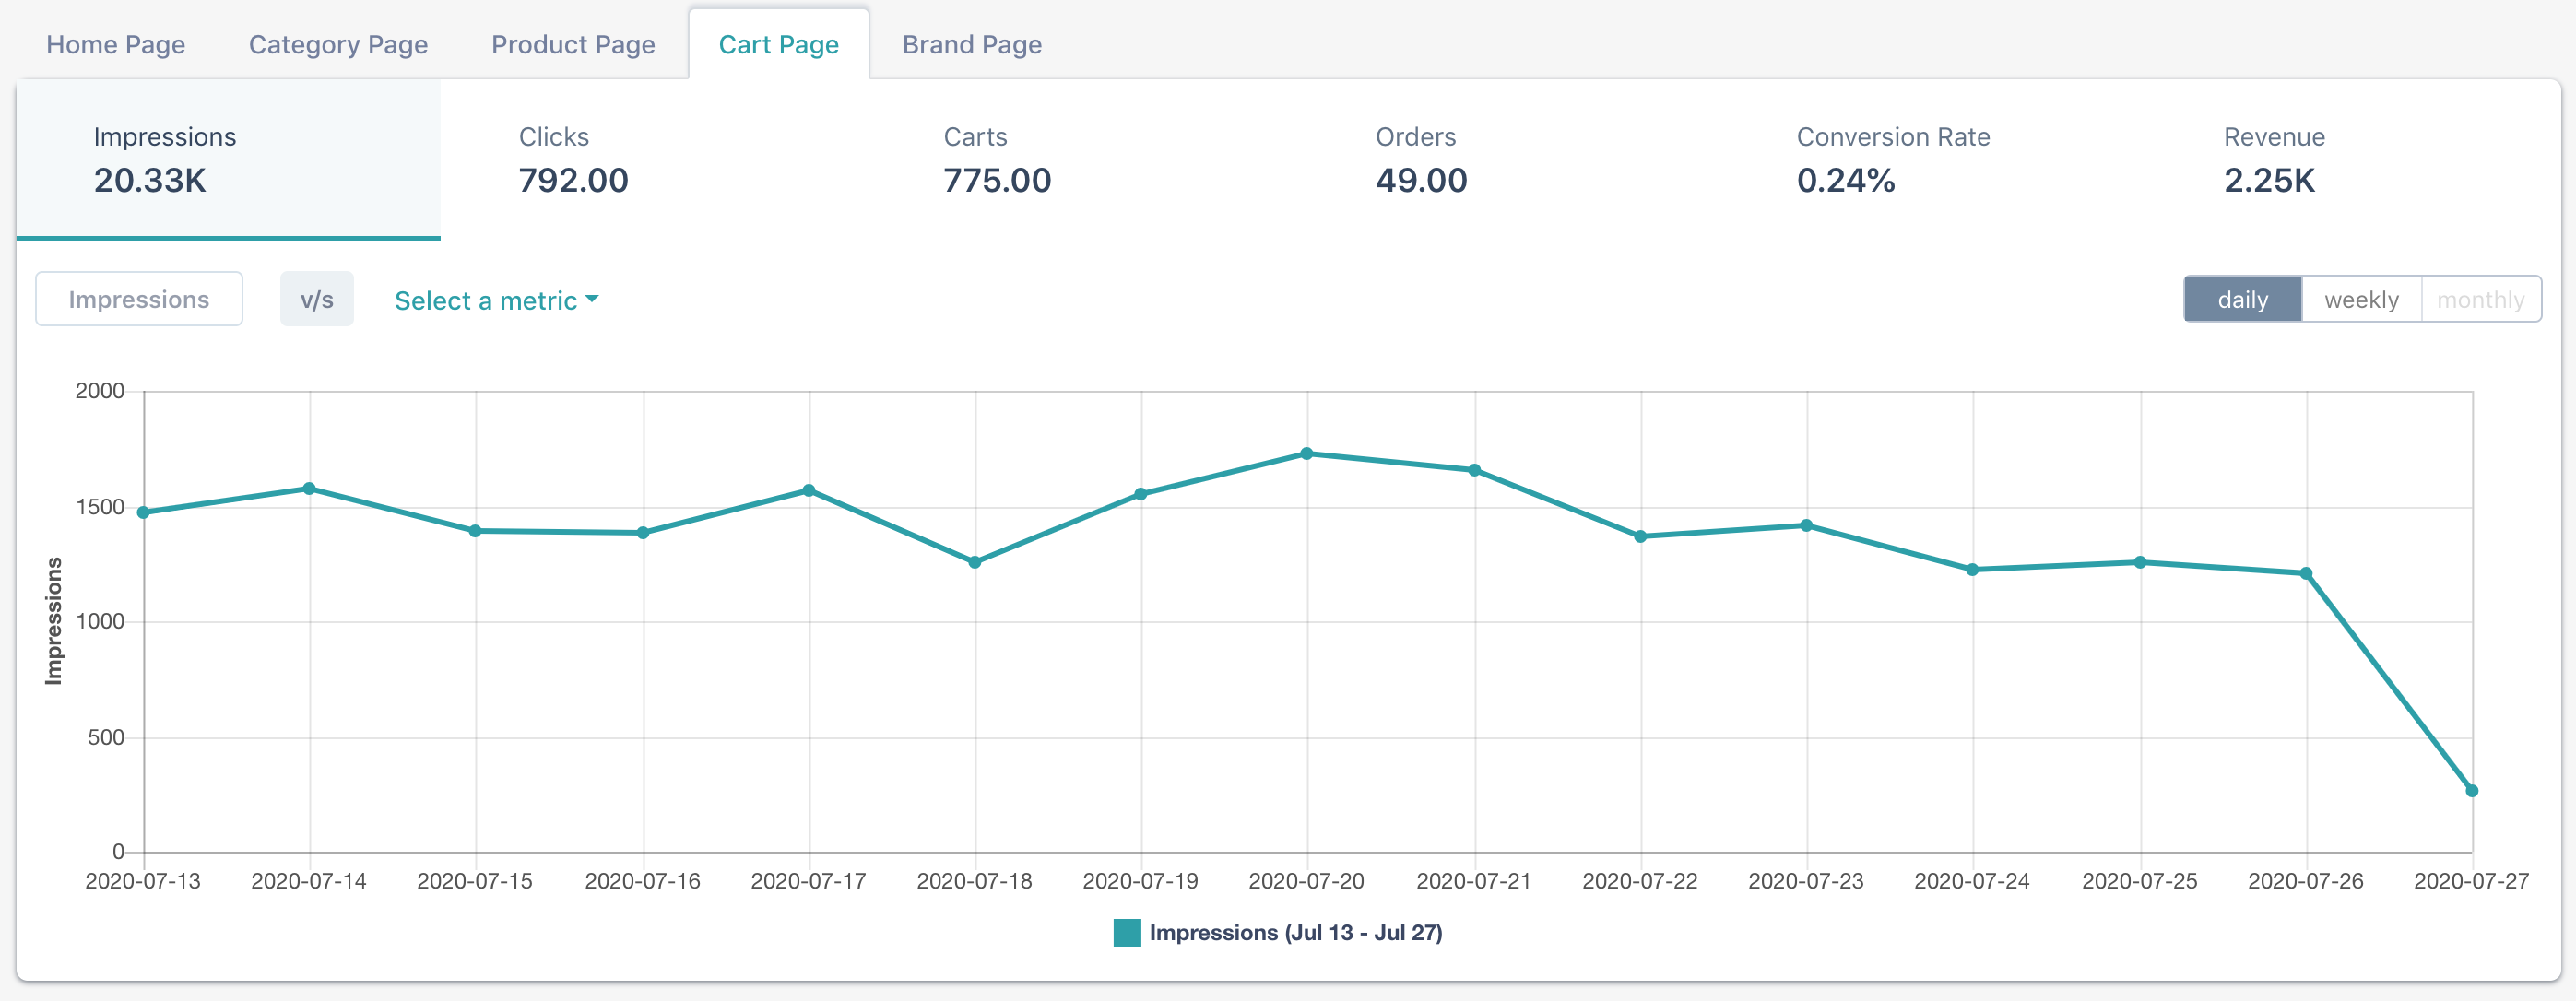
The recs report allows you to review trends in its performance over time. You can select and plot any 2 metrics from ‘Impressions’, ‘Clicks’, ‘Carts’ ,’Orders’, ‘Revenue’, or ‘% Conversion rate’ to check how the metrics varied over a selected duration.
A product manager or e-commerce Director can use this feature to quickly verify their hypothesis by studying the correlation between two parameters. For example, if you have revamped the UI of the product listing page on July 13 2020. You can plot a chart between Page Views & Clicks for the duration of July 13, 2020, to July 27, 2020. If the new UI is better than the old UI then you can spot a sudden jump in Clicks chart after July 17, 2020.
Selecting Date & Time for a report
Reports are always generated for a defined time range.
The Site report displays the metric of the site as to how many times the product was viewed from the category page, added to cart, or ordered.
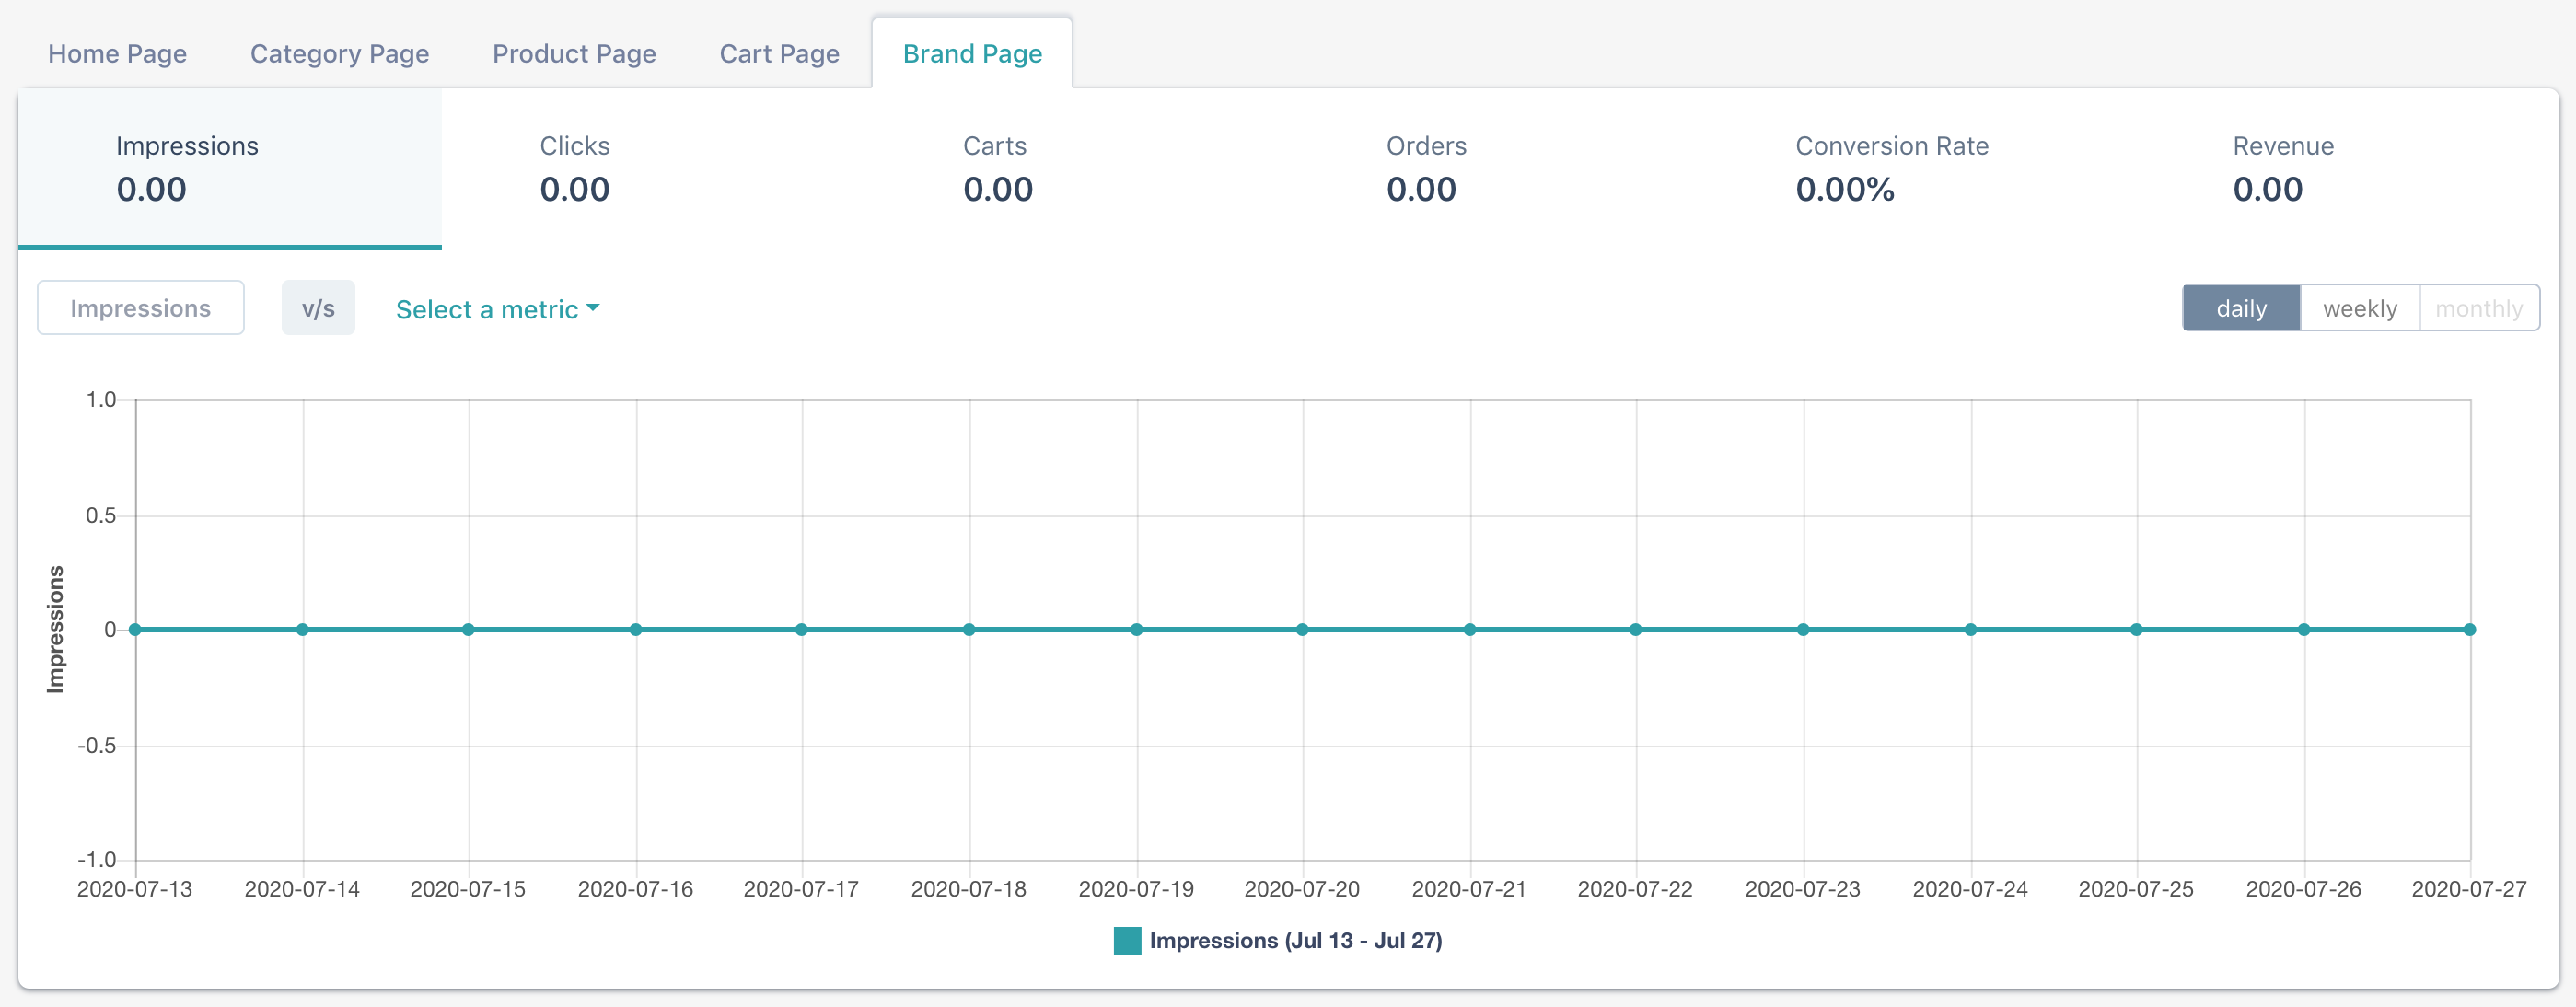
The page-level reporting section gives a detailed report of pages based on impressions, clicks, carts, orders, %conversion, CTR, and revenue.
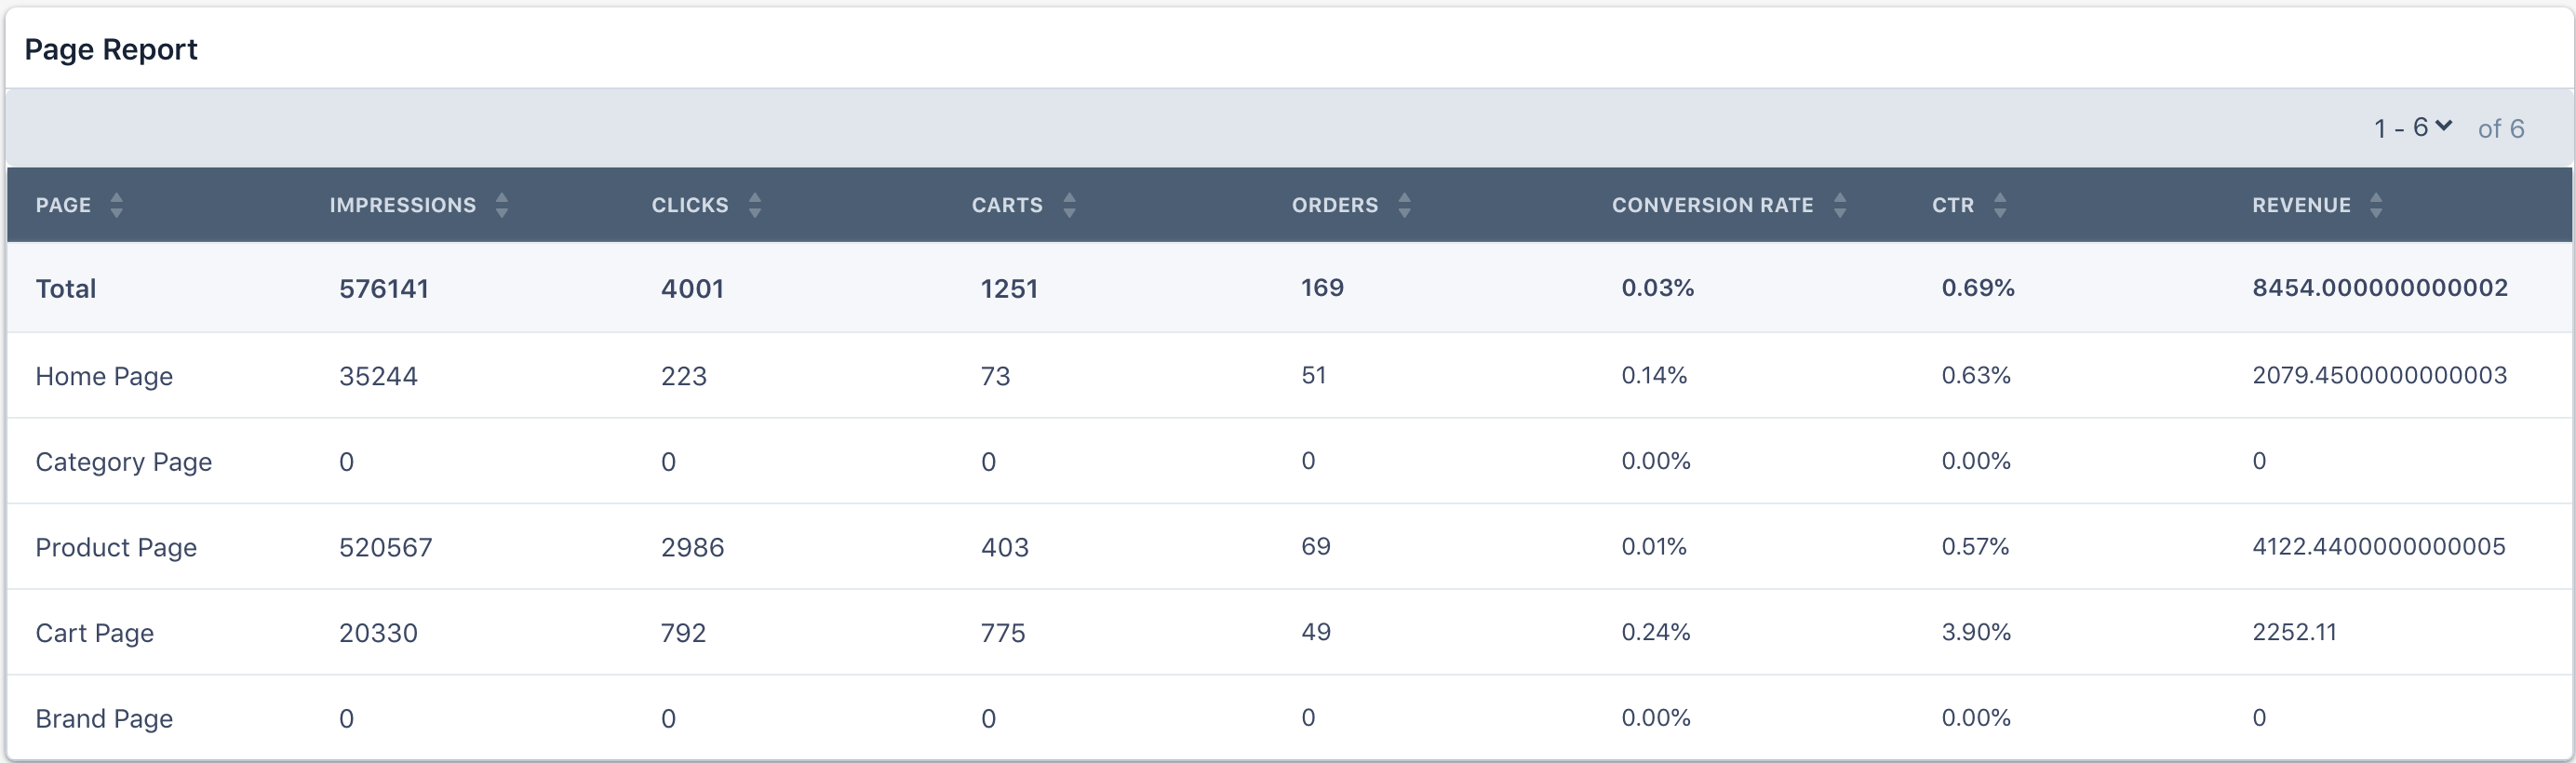
As you can see in the illustration above, we can decipher the insights for the various page types. With every page type, the impressions, clicks on the products recommended, added to the cart, and ordered are displayed. As a merchandiser, these insights may help you in boosting high performing page types.
The queries are sorted on hits in ascending order by default, you can however sort on any of the other metrics. A standard date selector interface lets you change the time period for the report.
Home Page Reports

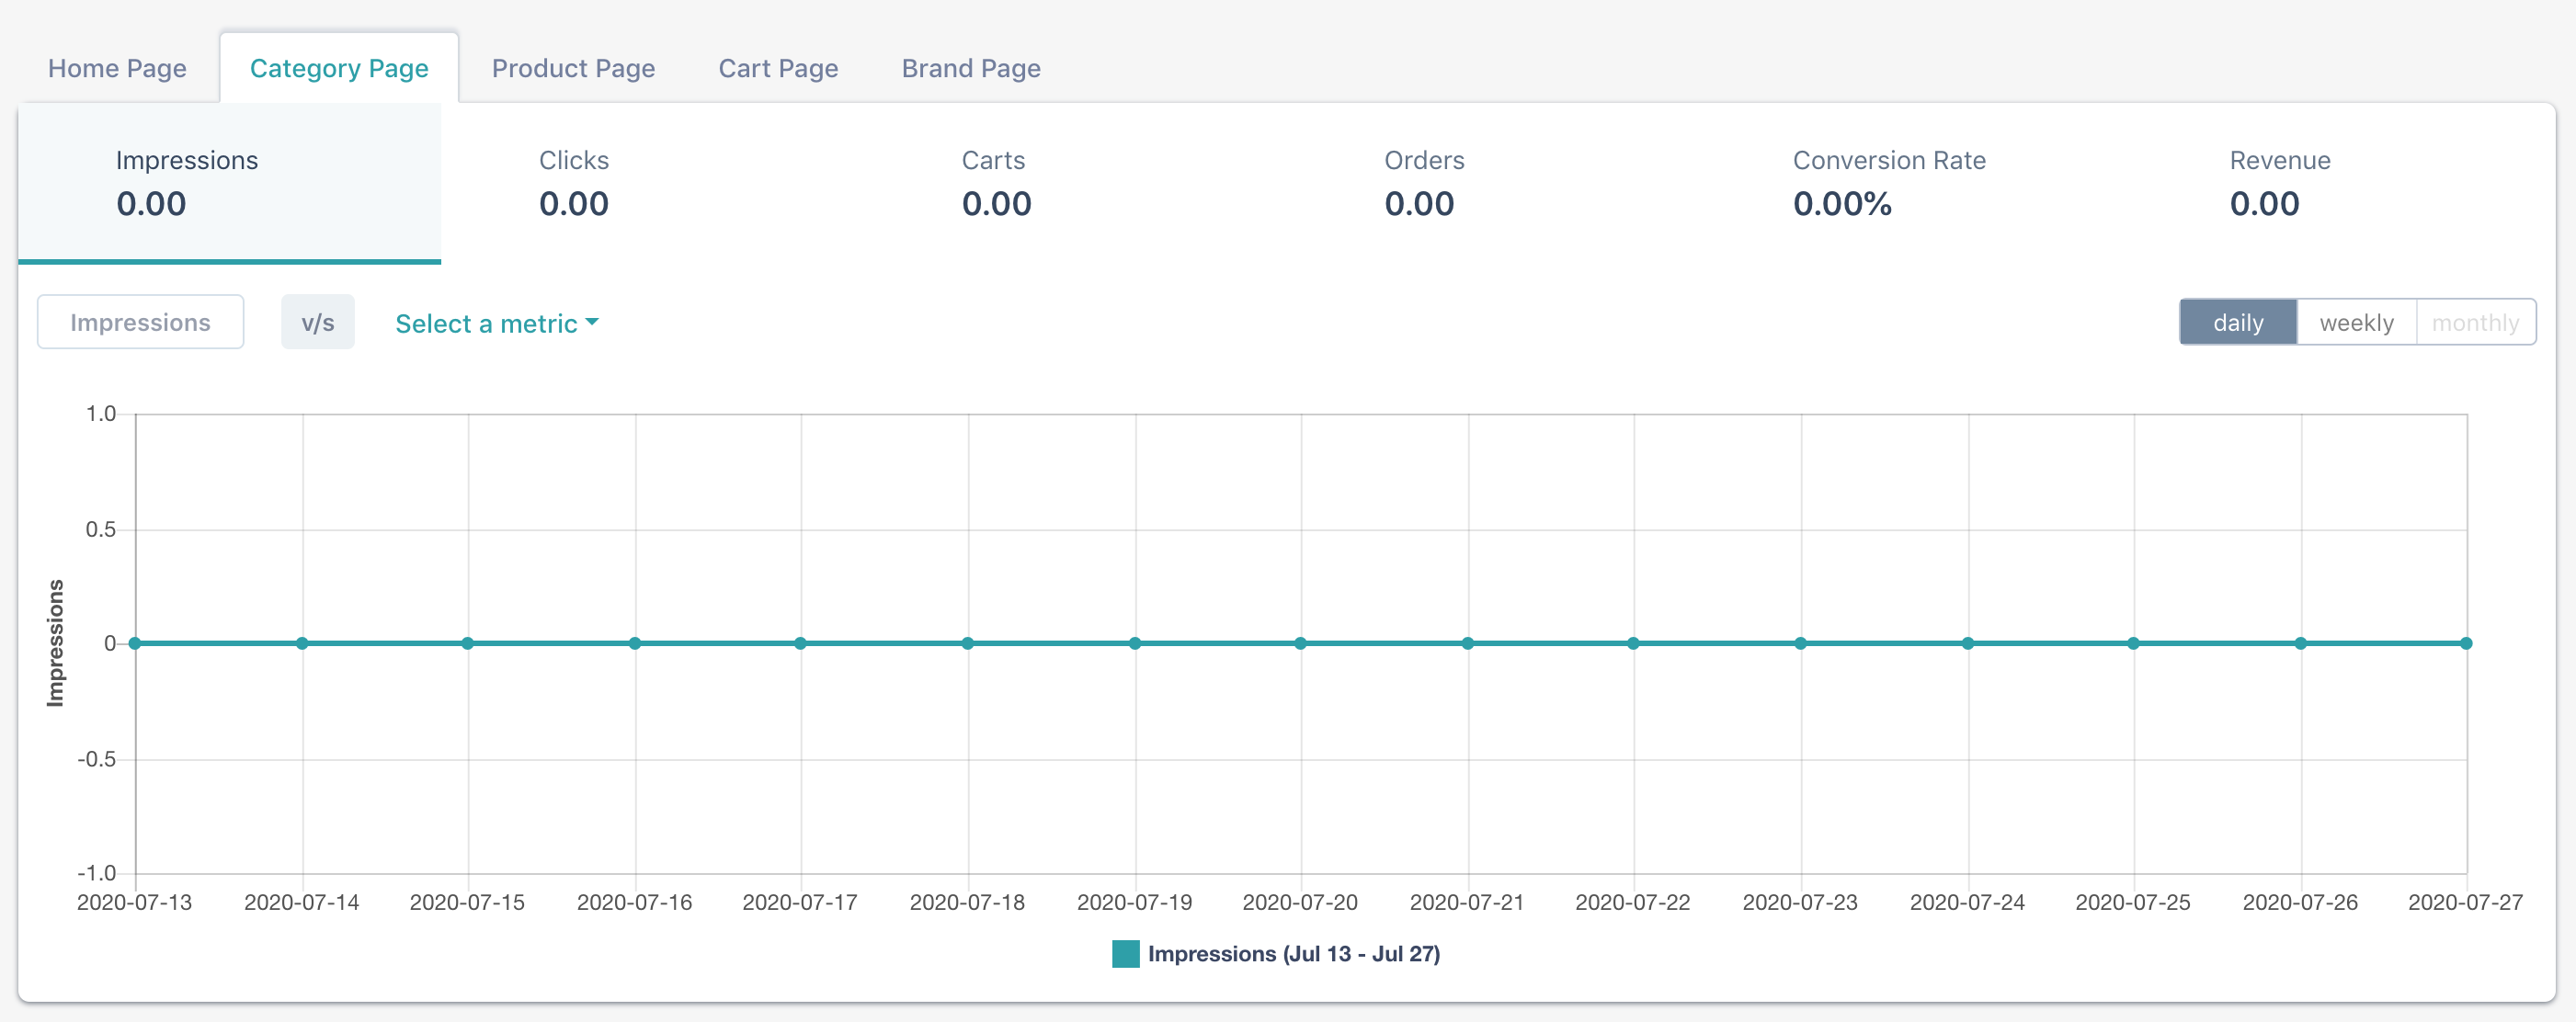
Category Page
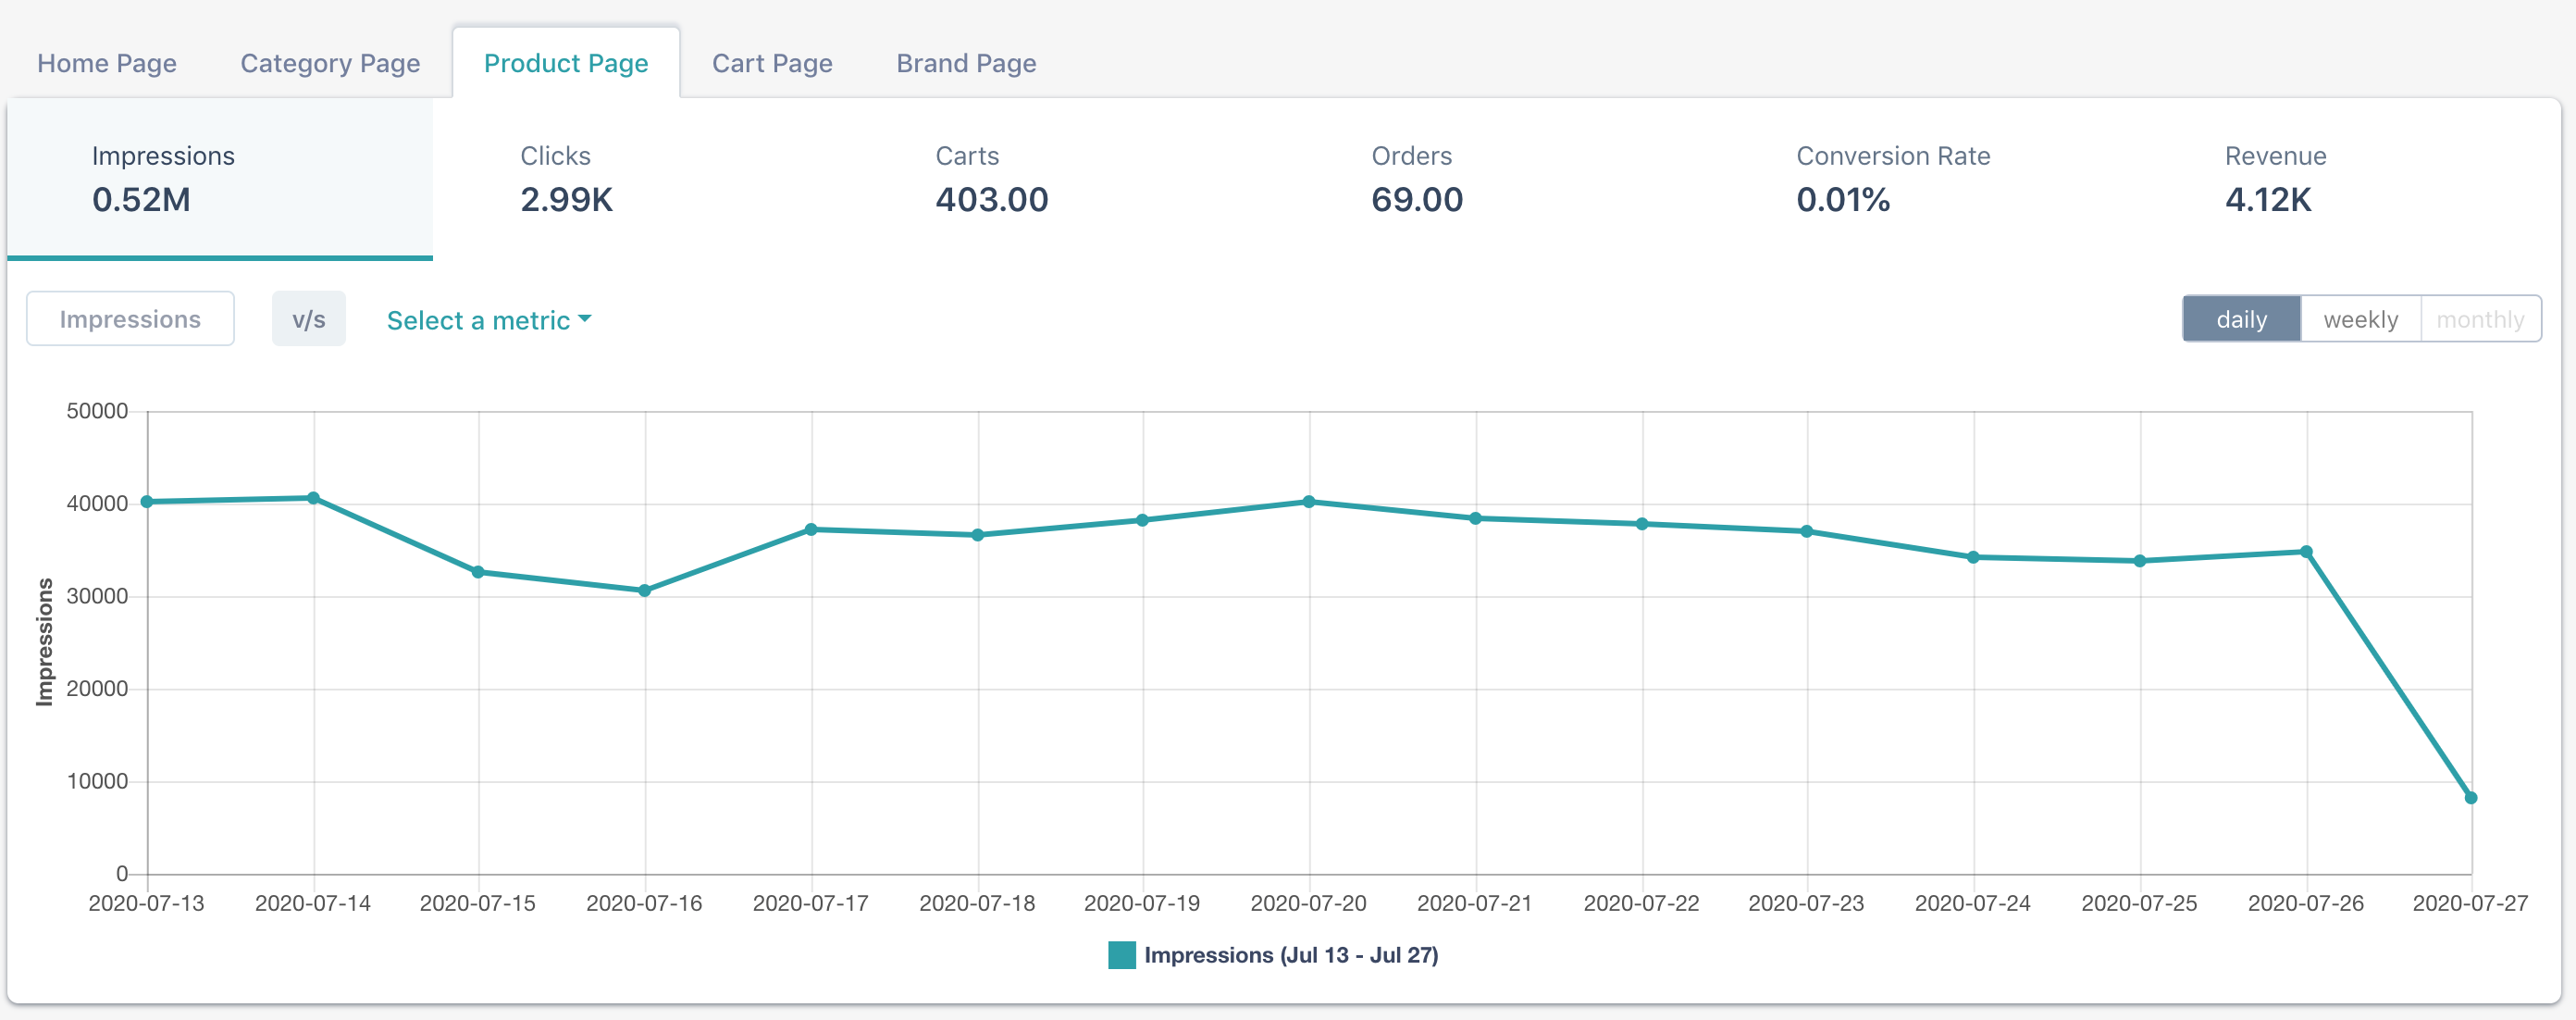
Product Page
Cart Page
Brand Page
Widget Reports gives an insightful report around the widget performance for each page type.
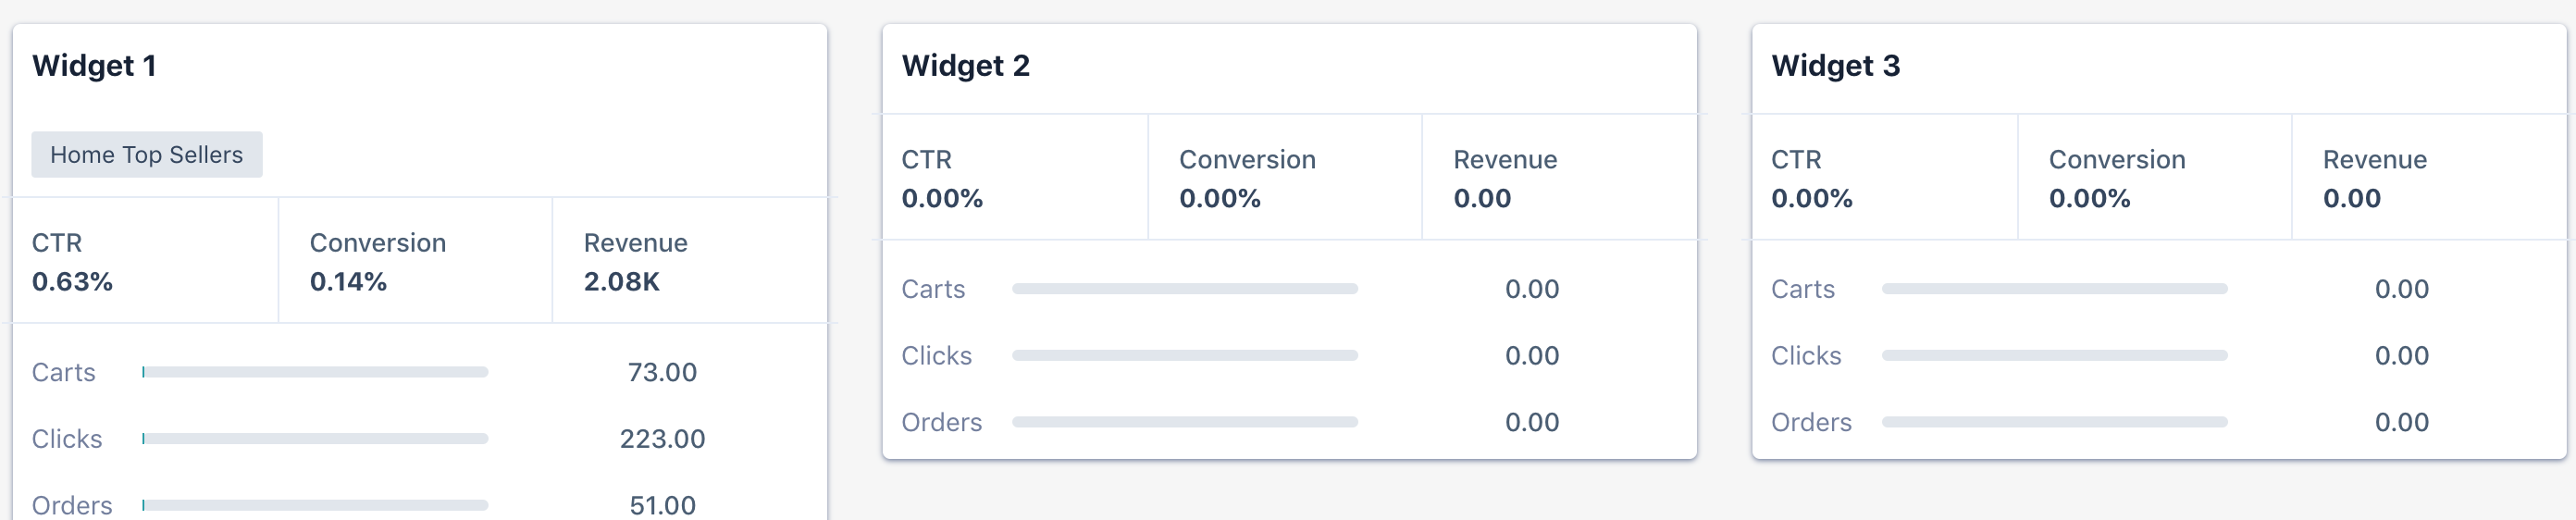
The widgets for the selected page type shows the insights of the calculated CTR, Conversion rate, and revenue.