
- Features
- Create a segment
- Facet Features
- Types of Facets
- Configure Facets
- Field Mapping
- Field Properties
- Real-time Preview
- Instantaneous Publishing
- Ranking Insights
- Clickstream Data
- Boost/Bury
- Sort
- Slot
- Pin
- Filter
- Landing Pages
- Set Banners
- Create a Site Rule
- Managing Field Rules
- Managing Page Rules
- Campaign
- Overall Performance
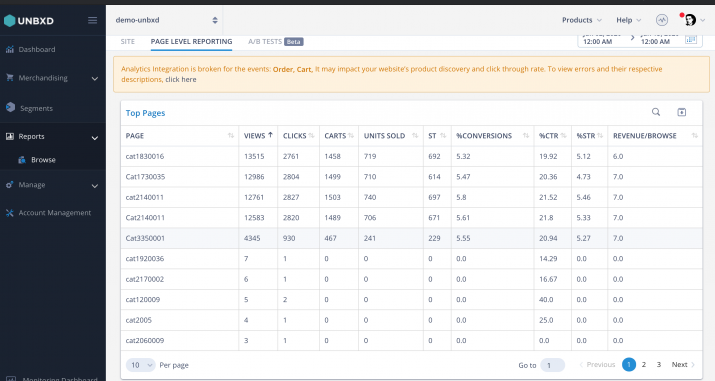
- Page-Level Reporting
- Zero Result Categories
- Product Reports
The overview page gives holistic view of essential performance metrics such as Clicks, Carts, Orders, %Conversion Rate, Top Page Views, Top Clicked Products, and Top Ordered Products, Zero Results Pages for the last 15 days. It helps merchandisers get a complete understanding of the trending queries, products, and the zero-results pages on a quick glance.
You can toggle between two types of graphs:
Trend
The trend graph lets you view the performance comparison of any two metrics for the selected time frame. You can choose to view the trends of – page views, carts, orders, and conversions and lets you easily switch between Daily, Weekly and Monthly reports.
Funnel
The funnel graph shows you the conversion funnel of the essential performance metrics data (hits, clicks, carts, orders) for the selected time frame.
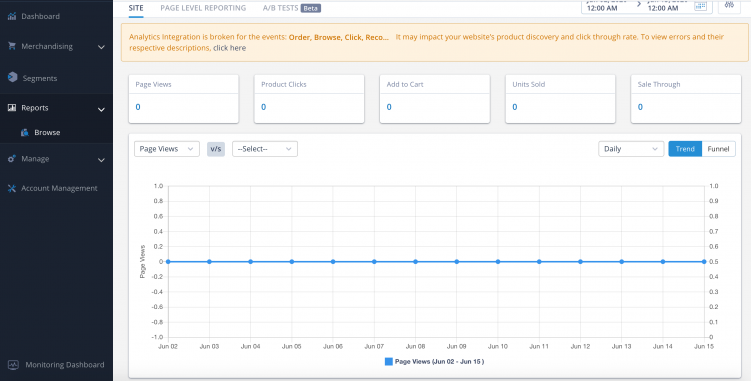
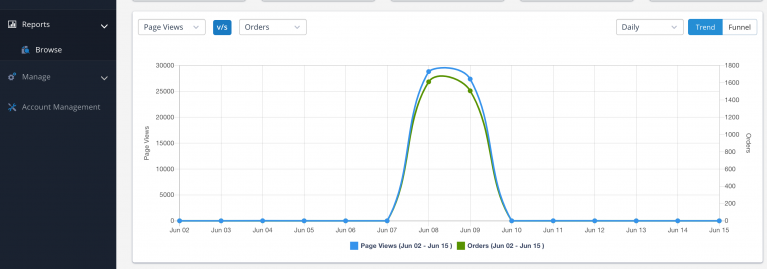
The browse report allows you to review trends in browse performance over time. You can select and plot any 2 metrics from ‘Page Views’, ‘Clicks’, ‘Carts’ ,’Orders’, ‘Revenue’, ‘% Conversion rate’, ‘%CTR’ and ‘AOV’ to check how the metrics varied over a selected duration.
A product manager or e-commerce Director can use this feature to quickly verify their hypothesis by studying correlation between two parameters. For example, if you have revamped the UI of the product listing page on April 07, 2020. You can plot a chart between Page Views & Clicks for the duration April 01,2020 to April 15,2020. If the new UI is better than the old UI then you can spot a sudden jump in Clicks chart after April 07,2020.
Before and After Comparison
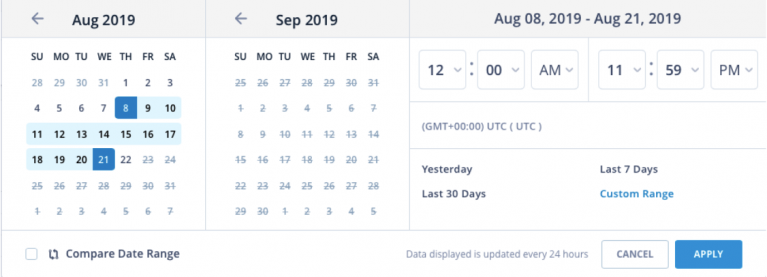
One of the most important factors to apply in this filter is ‘Compare Date Range’. The browse report allows you to plot and compare the trends for two separate time durations. You can enable this option by selecting the “Compare Date Range” checkbox in the date selection menu. ‘Compare Date Range’ allows you to select two different date ranges to generate a report depicting the comparison between those date ranges for the chosen metric.
The overall browse performance report provides options to filter data based on Location, Device and Visitor type. These filters can be used to study the performance of browse for a specific segment. These filters allow you to validate hypotheses related to specific device type, visitor type or Geography.
For example, if you have started a promotion for first time users and you want to evaluate if the promotion has led to higher conversions & higher traffic. You can apply a filter for Visitor type=New in the report, and plot conversion rates & traffic for time periods before the promotion and after the promotion launch.
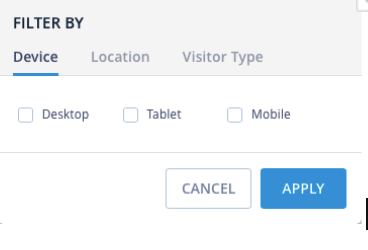
You can generate reports for a particular device, location, or visitor type by navigating to Reports > Browse and clicking the filter icon on the navigation panel near the calendar icon.
|
Attributes |
Description |
Representational Image |
|
Device |
Shoppers may access your site by logging in to either a desktop, mobile, or a tablet. The metrics for each device is calculated separately. You can filter by device and get the report. |
 |
|
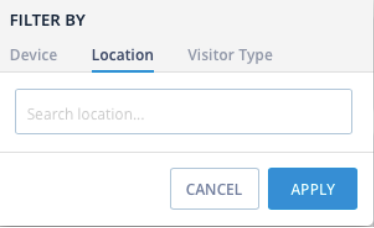
Location |
Shoppers may login to your site from different geographical regions. Metrics vary a big time with respect to different regions. You can filter by locations and get the particular metrics. |
 |
|
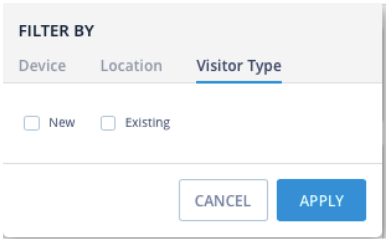
Visitor Type |
Shoppers are of two types: Either they are the ones who have already logged in once (existing) or who login for the first time (New). You can filter by visitor type and get a report for the type of shoppers. |
 |
Selecting Date & Time for report
Reports are always generated for a defined time range.
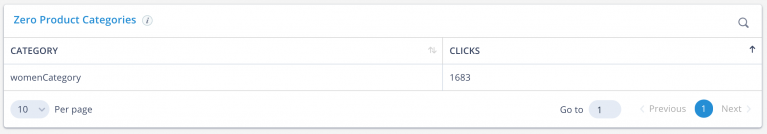
As we can see in the above illustration, there is a category ‘Women Category’ with a click of 1483 times which gave zero results.
Top 1000 products provide you a glimpse of the most ordered and viewed products on the website. The product report can help you in:
- Checking if the boosted products are performing well or if the negatively boosted products have received less number of views
- The changes in shoppers preference for products can be compared by checking the top products list for different time frames
- Identifying products with high visibility and low conversions. You can apply a negative boost for such products in order to suppress the ranking for such products.
- Identifying out-of-stock products : Products which are frequently added to cart but not ordered are a good candidate for out of stock products. A high cart drop-off rate for these products may also indicate the some of you competitors might be offering these products at lower prices.
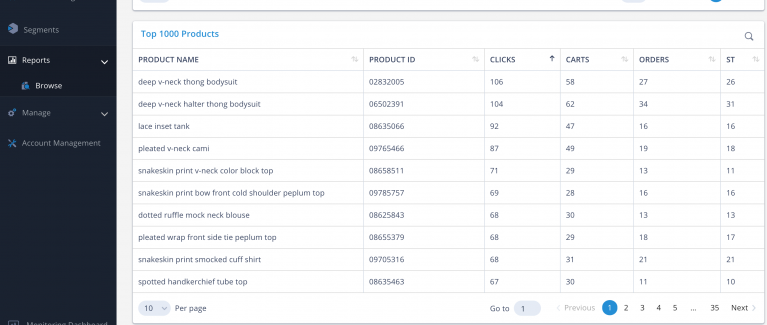
In the above illustration, you can see every product like ‘deep v-neck thong bodysuit’ was added to the cart 58 times, and ordered 27 times.
You can sort the products based on any of the metrics to see the most sold products, most viewed product or the product added to cart maximum number of times. To download a product report, click the download icon on the top-right part of the screen. Field mapping is required to display the ‘Product name’ & ‘Unique ID’ correctly.
- Did this answer your question?

